
Home Services
Just Better Moving
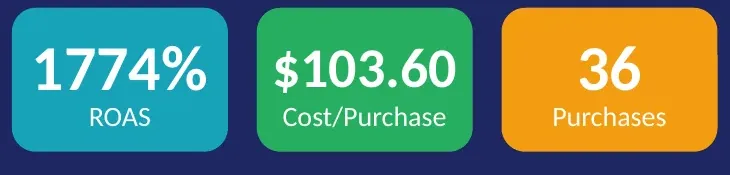
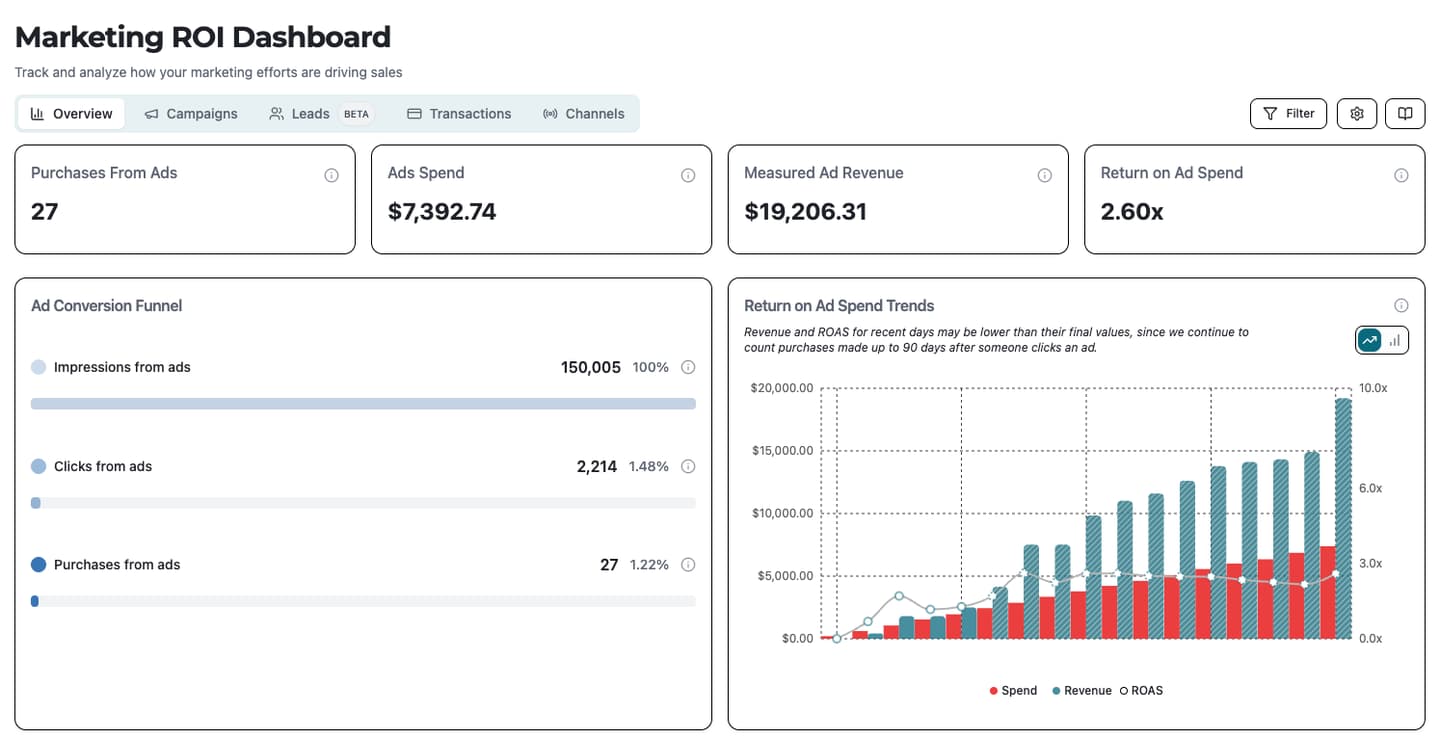
2.60x ROAS across the first 16 weeks, plus $6,186 booked from organic search in the first eight, from an account that couldn't attribute a single lead.
- Return on Ad Spend
- 2.60x
- $19,206.31 in measured booking revenue on $7,392.74 of ad spend across the first 16 weeks, up from 2.40x at week seven. Still a floor, since purchases count for up to 90 days after the click
- Cost per Click
- -76%
- $13.77 on the owner's DIY campaign down to $3.34 over 16 weeks — service-line ad groups and a negative-keyword wall bought qualified clicks instead of rental-truck confusion
- Booked Moves from Ads
- 27
- Up from zero attributable leads before the rebuild — first-touch attribution ties every booked job back to its originating click and real dollar value
- Signed to Live
- 30 Days
- Full Next.js rebuild with Enhanced Conversions, verified lead tracking, and 50+ preserved legacy URLs — shipped before the new campaigns took the budget
The Challenge
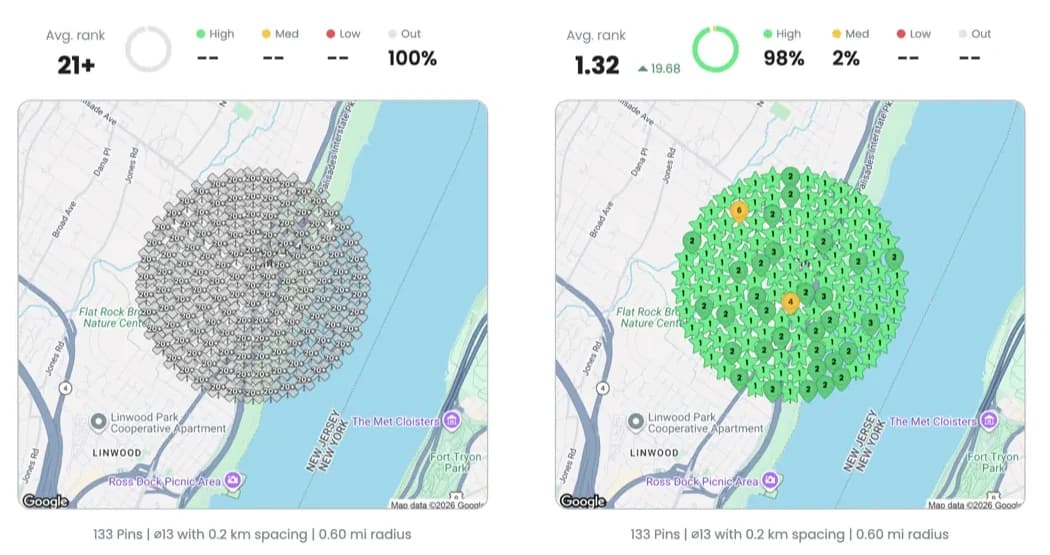
Just Better Moving is a Parsippany, NJ mover with a genuine differentiator — a piano-moving specialty with Steinway, Yamaha, and Carnegie Hall on the client list — that its marketing couldn't cash in. The owner's DIY Google Ads campaign spent $2,260 in 30 days at a $13.77 cost per click, produced 164 clicks, and couldn't attribute a single lead; the phone calls it did generate were people looking for U-Haul rentals. Smart Bidding was optimizing toward junk 'local actions' signals (76 of 106 monthly conversions), the aging WordPress site gave qualified visitors little reason to convert, and the brand ranked #1 for its own name while staying invisible on every unbranded search that actually wins new customers. If this sounds familiar, read our post on hiring a web design agency in NJ.
Our Approach
We rebuilt the foundation before scaling the spend. Thirty days after signing, a 47-page Next.js site was live — copy built around the piano specialty as the credibility wedge ('Movers who treat your couch like a Steinway'), with 50+ legacy WordPress URLs 301-redirected so a decade of SEO equity survived the cutover. Then we made the results measurable: Enhanced Conversions with hashed user data, first-touch click-ID capture that survives the CRM handoff, and lead conversions that fire only on verified form submissions — never on page loads. With honest tracking in place, we rebuilt the Google Ads account from zero: ad groups split by service line, and a negative-keyword wall that filters out the rental and U-Haul traffic that used to eat the budget. The ROAS numbers here come from the client's own marketing dashboard, where every booked move ties back to the ad click that produced it. The rebuild also opened a second front: with the piano-specialty pages live and a decade of URL equity preserved, unpaid organic search became a measurable booked-move channel of its own, tracked lead by lead in the client's CRM. The work behind these numbers is our website rebuild services. We cover the thinking behind this in five websites built in two days each. Planning something similar? Read our post on WordPress vs Shopify for small businesses.